

Estimated reading time: 21 minutes
Here’s how stock research used to look for me.
One tab for the financials. One for the news. One for a YouTube guru shouting that it’s going up. And one more for a Reddit thread insisting the whole thing is a bubble.
Two hours later: thirty tabs, a headache, no clearer than when I started, and I’d buy it anyway, based mostly on vibes.
So this time I tried something different. One stock, researched end to end, inside a single app. No Google. No news sites. No YouTube. No Reddit. Just Moomoo. If I had to use anything else to look something up, the challenge was over.
Six levels, in the order real research actually happens: find the opportunity, understand the business, check the numbers, find out what everyone else thinks, compare it against competitors, then place the trade properly. Each level gets a green tick or it doesn’t.
One question runs through all six: can one app really do the job that used to take thirty tabs?
TABLE OF CONTENTS
Level 1: How To Find Stock Opportunities
Before you can research a stock, you have to find one.
Most people find theirs in a WhatsApp group. Somebody’s uncle says a counter is going to fly, so they buy it. That’s the entire process.
And yes, this point gets made constantly, but it keeps happening. The Securities Commission surveyed around 1,300 Malaysian investors, and 55% of respondents said they had been given advice that turned out to be fraudulent. A third of all respondents lost money. The most common entry point was a friend or family member, or a seminar.
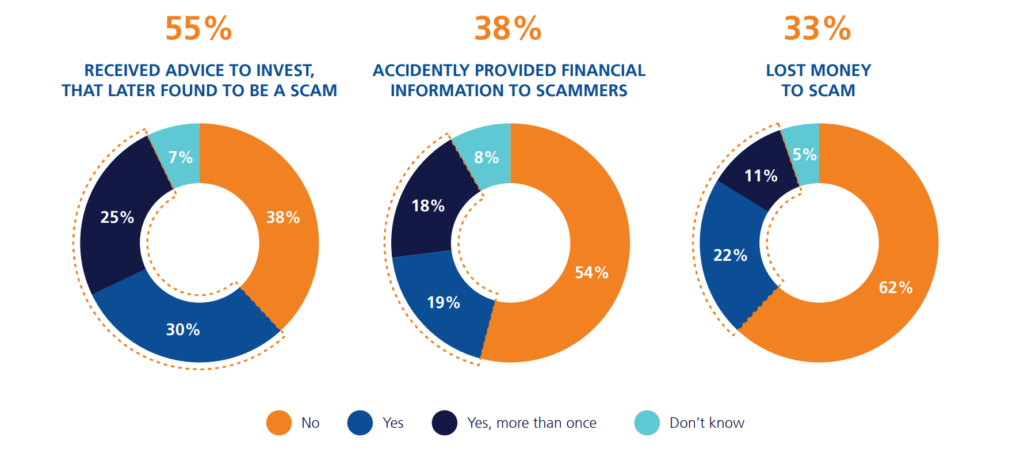
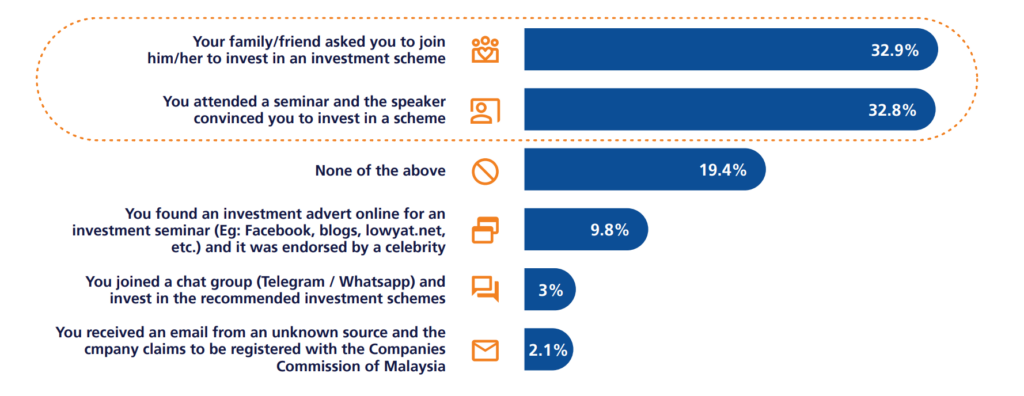
Not every hot tip is a scam. But look at how the decision gets made: follow whoever told you, skip the homework entirely.
So how do you find a stock without someone handing you one? Inside Moomoo, there are two routes.
First, Heat List.
Here’s how you can explore the Heat List yourself on Moomoo app:
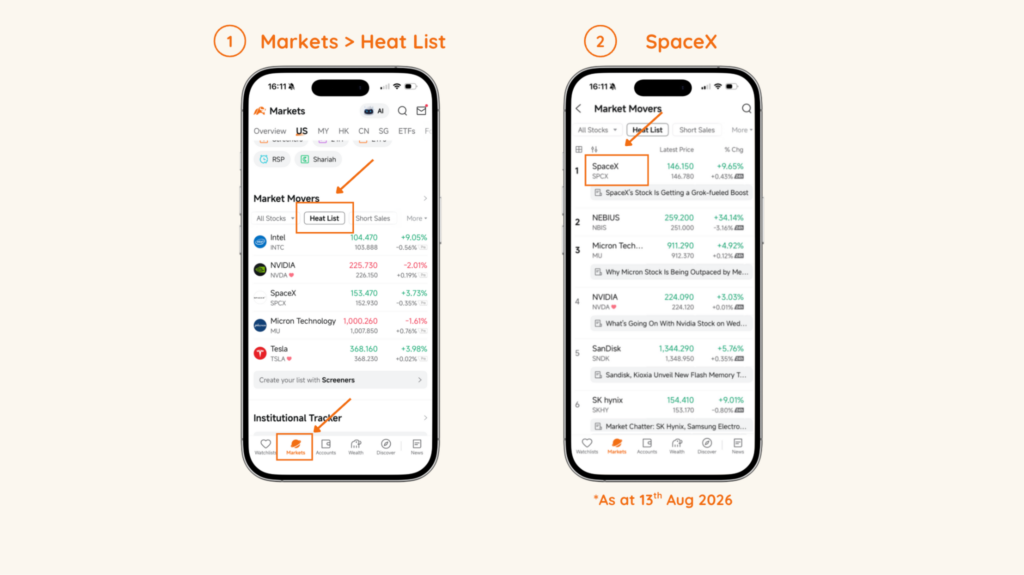
It shows what’s actually moving today. But it only tells you which stock is getting the most attention right now, and nothing about whether the business is any good.
For me, the screener is the better tool, because you set the rules and the app filter for you.
I prefer profitable companies that are still growing, so my filters are fairly strict:
| Criteria | My setting | Why |
| Market cap | > USD 10 billion | Too large for any single player to push around, and the accounts are properly audited |
| Net profit margin | > 15% | Plenty of companies grow revenue. I want the ones that keep money at the end |
| Operating profit (TTM) | > USD 1 billion | Real scale |
| Operating profit YoY (annual) | > 20% | The core business is compounding, not stalling |
| Current asset ratio (annual) | > 60% | Enough liquidity to absorb a shock without panic-selling assets |
Step to Use Moomoo’s Screener:
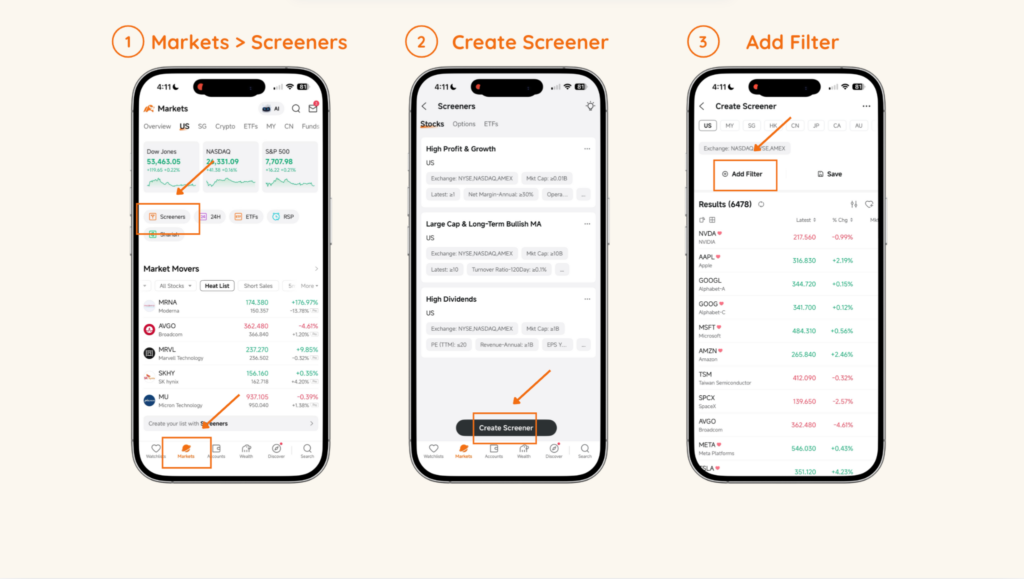
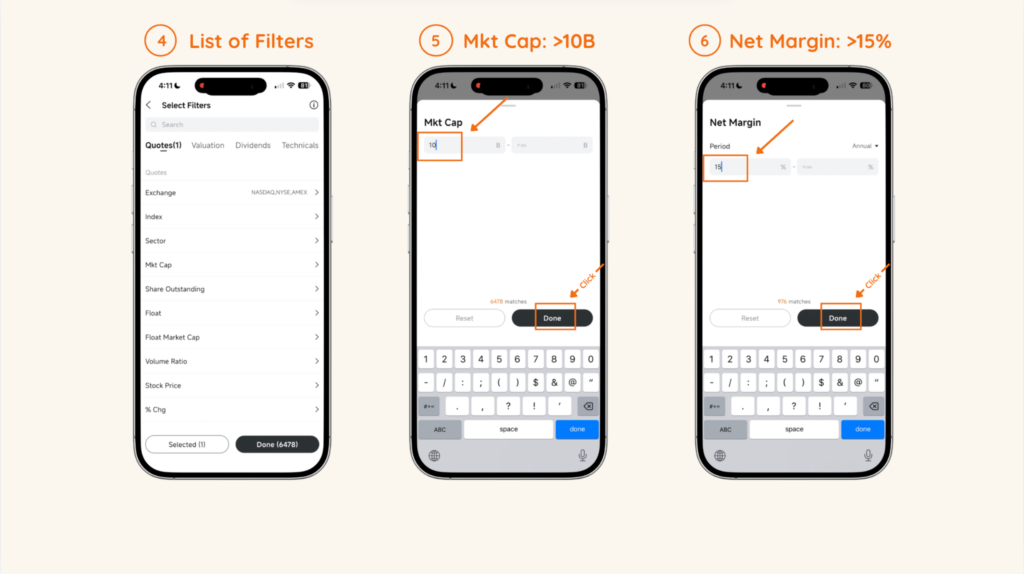
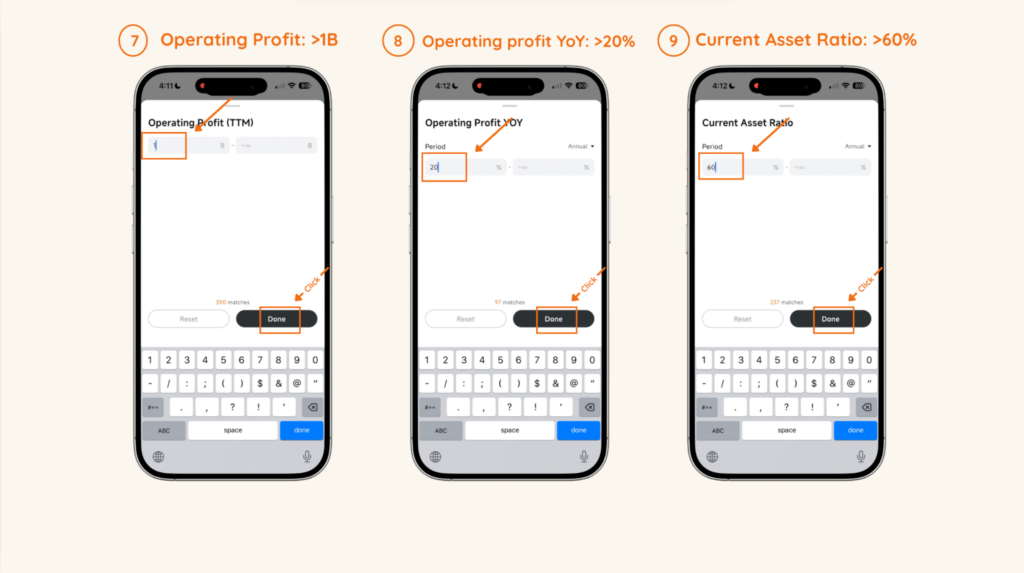
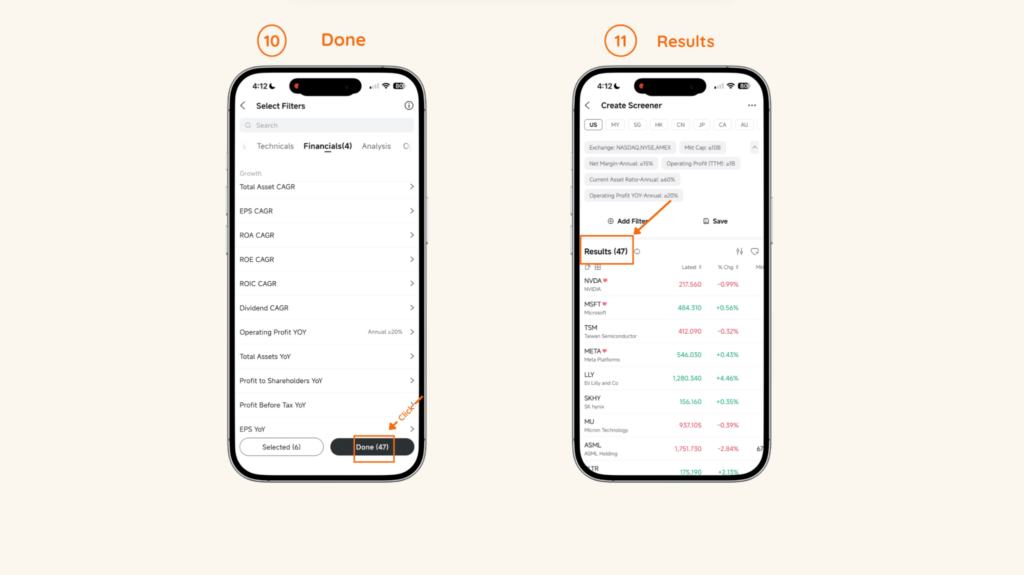
These are the companies that survived from my filter: Nvidia, TSMC, SK Hynix.
Nvidia is the one worth digging into, so that’s the stock for the rest of this exercise.
Level 1: green tick. Filtered stocks against my own rules, without leaving the app.
Level 2: Understanding the Business Through Research
Having a ticker is not the same as understanding a business.
Normally this is where I’d Google “what does this company actually do?”. Instead, I asked Moomoo AI inside the app: what does Nvidia do, and what’s moving the stock right now? A few seconds, and I had the answer.
Step to Use Moomoo’s AI:
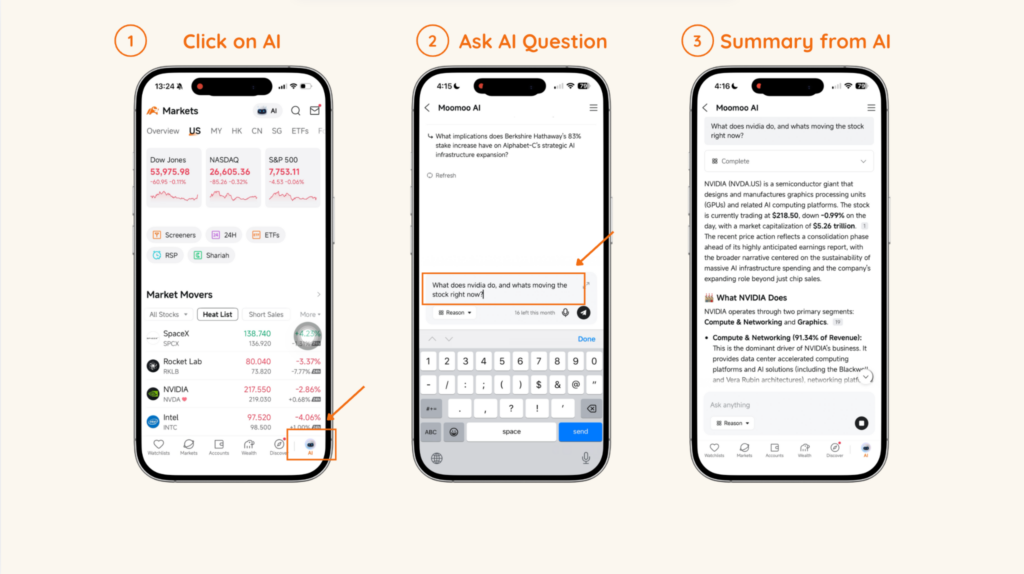
Then I did something more interesting. I asked one hard question three times, to test the three modes: Flash answers fast, Reason analyses in depth, and Expert takes on complex, multi-step work.
The question:
Hyperscalers like Amazon, Google, and Meta are Nvidia’s biggest customers, but they are all building their own custom AI silicon. Explain how this specifically threatens Nvidia’s 74% gross margins, not just their revenue.
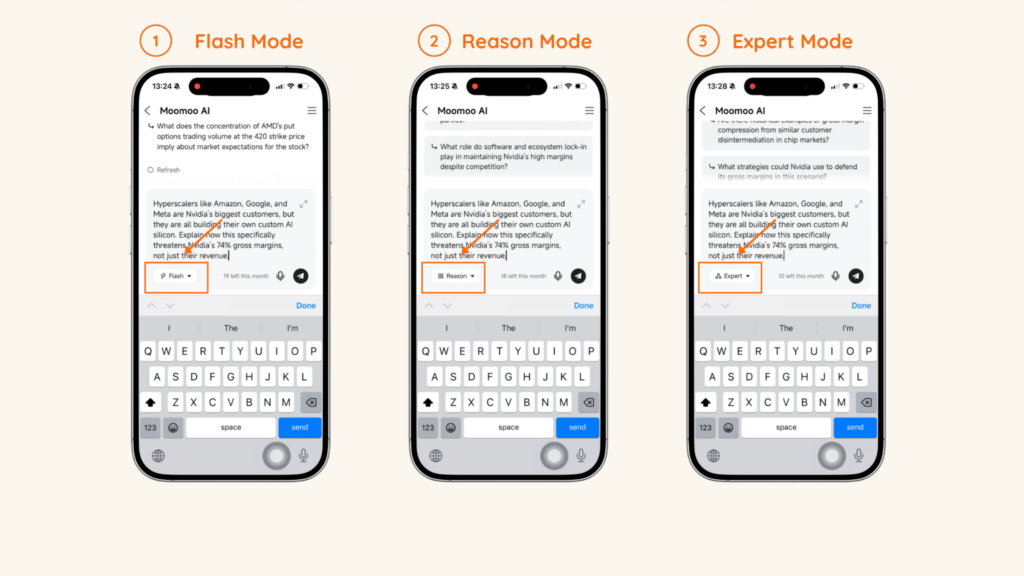
Flash came back almost instantly, and the answer was solid. It named the competing chips, quoted an analyst, explaining the mechanics of the squeeze. But something stands out: it only argues one way. Every line is about why this is a threat.
Reason went further. It showed its thinking first, then dug into Nvidia’s own numbers, how much revenue depends on a handful of customers, and how much Nvidia is spending to stay ahead. Crucially, it did something Flash didn’t: it explained what Nvidia is doing to fight back, and put a figure on how bad the damage could realistically get.
Expert took the longest. It wrote itself a research plan, ran a series of searches, then handed off to a second agent to build a chart.
And it found a threat the other two missed entirely.
Flash and Reason both landed on the same mechanism: big customers gain bargaining power, so Nvidia has to cut prices. Fair enough. But Expert also checked the cost side, and found that the memory chips going into these products have risen 60% to 70% in a year.
Which means the margin is being squeezed from both directions at once, selling prices under pressure, manufacturing costs climbing. That’s a completely different mechanism, and only one of the three modes went looking for it. Expert then argued against itself, quoted the analysts who think the whole bear case is overdone, and gave the actual forecast.
Expert wins here for one reason: it was the only mode that went hunting for what it might be getting wrong.
That’s the case for choosing your mode deliberately before you ask. And whichever you pick, the same rule applies, AI is a tool. Even the Expert report is a starting point, you should go and verify it.
Next, how I read the news feed without drowning in it.
Which brings me to the Discover tab and its news section. I used to pay for several subscriptions just to keep up with the market. Inside the app it’s free, organised across the top by Headlines, Latest, and Watchlists.
Step to Read News on Moomoo:

And you might ask: Is news actually a signal, though, or just noise?
Honestly, almost 90% of financial news is noise to make you panic-sell or FOMO-buy. But the remaining 10% tells you about a real change in the business: a CEO shakeup, a major government contract, an earnings report that genuinely beats expectations.
The Watchlist filter is where to start. It won’t tell you which story is signal, but it strips out every company you don’t own, and that kills most of the noise before you read a word.
Here’s how I read two stories at the top of the feed.
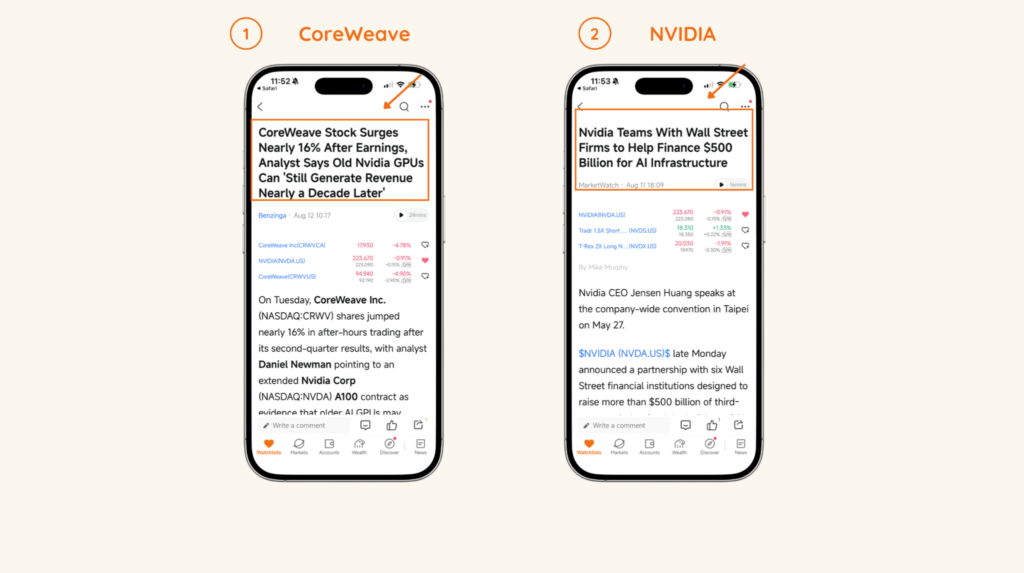
CoreWeave. Not Nvidia, but tagged as closely related, think of CoreWeave as a landlord for AI computing power. It buys Nvidia chips, puts them in data centres, and rents them out. It had just reported quarterly results: revenue doubled to USD 2.58 billion, and the stock jumped 16% after hours.
That last part is the noise. A 16% move tells you nothing about the business. The signal was buried further down: CoreWeave signed a contract for chips it originally bought back in 2020, running all the way to 2029.
Why does that matter? The loudest worry about the entire AI buildout is that these chips go obsolete in two or three years. If that’s true, companies are burning billions on equipment that becomes scrap before it pays for itself. A 2020 chip still collecting rent in 2029 points the other way. One contract doesn’t settle the argument, nobody honestly knows whether the real answer is three years or seven, but it’s evidence. That’s what makes it signal.
Next, Nvidia itself. It signed an agreement with six of the biggest names in finance to arrange more than USD 500 billion in loans to build AI infrastructure.
Read it carefully: the money is for Nvidia’s customers. Nvidia’s chips are expensive, and plenty of buyers can’t pay cash, not Google or Meta, but the smaller AI companies. They want the chips, so they need to borrow.
The structure is familiar. They borrow to buy the chips, and the chips become security on the loan, the same way a house secures a mortgage. When they miss the payments and the lender takes the hardware.
No money has actually been raised yet, this is only an agreement. And the whole plan rests on one question: in five or ten years, is a used AI chip still worth good money?
Nvidia’s answer is that customers today are still running chips from 2020. That’s true. But utility value and market value are two different things. A chip can be busy every single day and still rent for a fraction of its original price. Nobody knows that number yet.
Neither story settles anything, and that’s the honest limit of a news feed. But that’s how I read one: ignore anything that’s only about the price, check whether something actually happened or somebody merely said something, and look for whether the stories connect, because they usually do.
Level 2: green tick. The app can narrow the noise for you. Deciding which signal actually matters is still your job.
Level 3: Conduct Fundamental Analysis On A Company
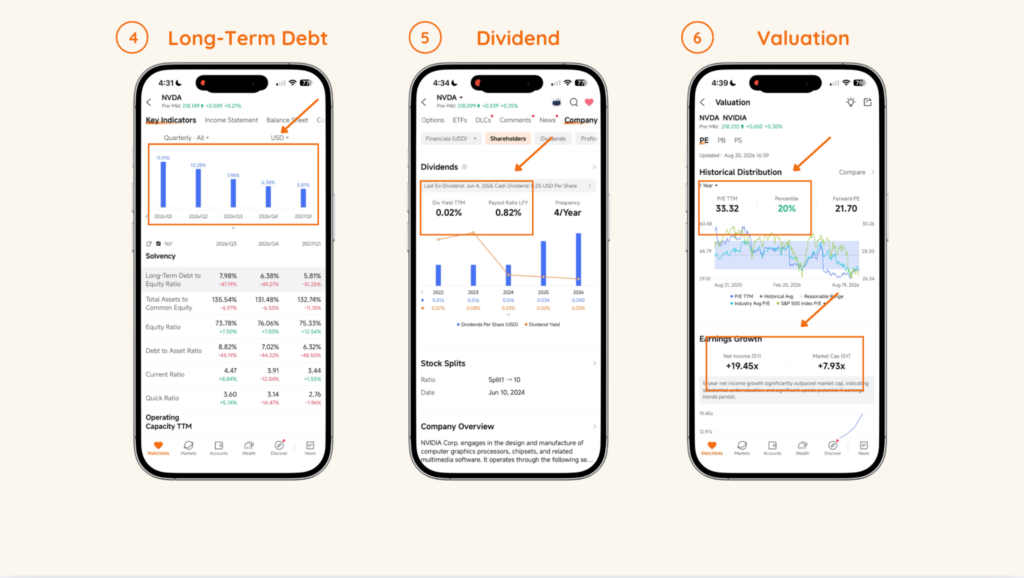
News and narrative mean nothing if the business doesn’t hold up. This is the level that matters most, and the one where most retail investors quit.
Five questions. Every answer is already on the stock page.
Step to Use Moomoo’s Company Financials:
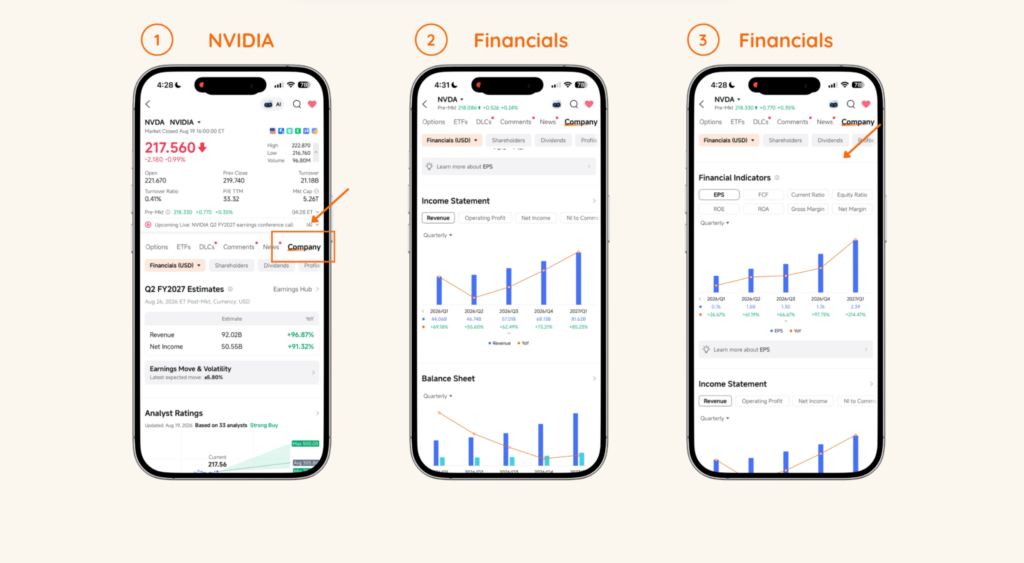
1. Is revenue growing?
Yes, steadily, quarter after quarter.
2. Are gross margins stable, or getting squeezed?
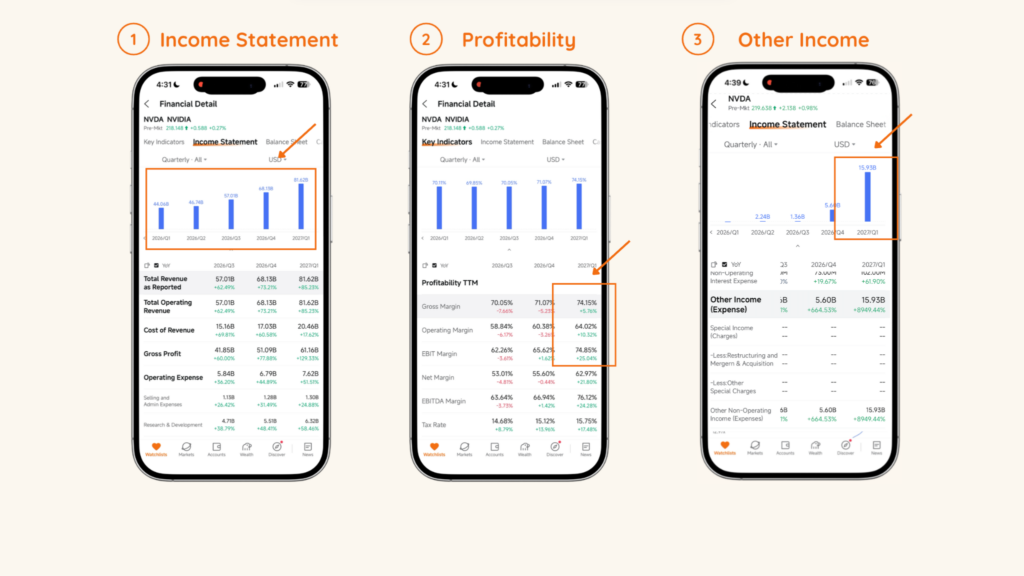
Rising. Roughly 74 dollars of gross profit on every 100 dollars of chips sold. For a company shipping physical hardware, that’s exceptional, and margins moving up tell you nobody has yet been able to force Nvidia to cut price.
But look more carefully, because there’s something hiding in these rows. Operating margin: 64%. EBIT margin: 75%, that’s Earnings Before Interest and Tax. Normally EBIT shouldn’t exceed operating profit if all the money is coming from the core business. That gap of roughly 10 percentage points is income from somewhere else.
Dig into the results and you find it: last quarter Nvidia booked almost USD 16 billion of gains on shares it holds in other companies.
That’s real money, and it’s properly disclosed. It just didn’t come from selling chips.
3. Is the debt manageable?
Next, Solvency. A year ago the long-term debt-to-equity ratio was around 12%. Today it’s about 6%, the debt burden effectively halved. The current ratio sits at 3.44, meaning roughly three and a half times more short-term assets than short-term liabilities.
Comfortable, on both counts.
4. Does it pay dividends, and consistently?
Barely. A yield of 0.02% and a payout ratio of 0.82%. Over 99% of profit stays in the business and gets reinvested.
If you’re buying Nvidia for passive income, you have the wrong stock.
5. Is the PE ratio reasonable, or are you overpaying for hype?
Quick test before the answer: right now, do you think Nvidia is cheap, fairly priced, or expensive?
The PE is 33.32, about 33 dollars paid for every one dollar of annual profit. Sounds expensive. But check the percentile: Nvidia’s PE has been lower than today’s level only about 20% of the time, and you can watch it happening on the chart, that line sliding down all year.
So measured against its own trading history, today sits near the cheap end.
How is that possible while the share price keeps climbing? Over five years the company became roughly 8 times more valuable, and its profit grew 19 times. The price ran fast. The profit ran faster.
One caveat before moving on: those USD 16 billion of investment gains are inside this number too. Strip them out and 33 gets a little more expensive. Nobody hid it, it’s in the release. But if you only read the headline, you’d miss it entirely.
So is it cheap? Against its own past, yes. Against its competitors, that’s Level 5.
Level 3: green tick. Five questions answered in one app.
Level 4: What Everyone Else Thinks
I understand the business now. What I want next is the best argument against it, because if I only listen to fans, I’m not thinking clearly.
Normally that’s a Reddit and Facebook job. Today it’s Moomoo‘s analyst ratings and comments tab, side by side.
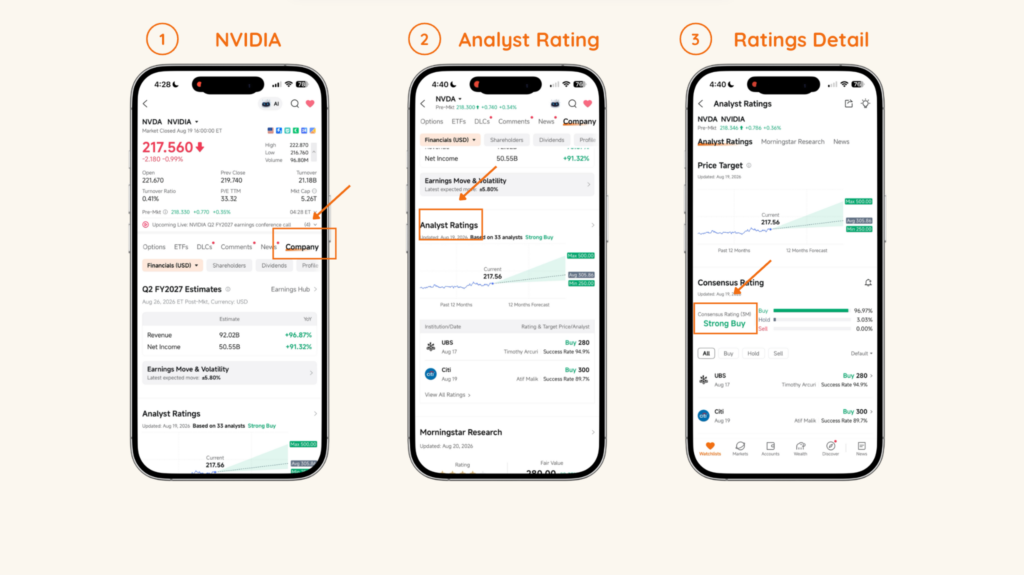
The professionals first. Most analysts covering Nvidia rate it a Buy, and the average twelve-month target sits well above today’s price. Worth understanding what a target price is: an analyst’s estimate of where the stock lands in twelve months. They’re paid to hold an opinion, and those targets get revised the moment the next quarter drops. It’s just a temperature check.
Step to Use Moomoo’s Analyst Ratings:
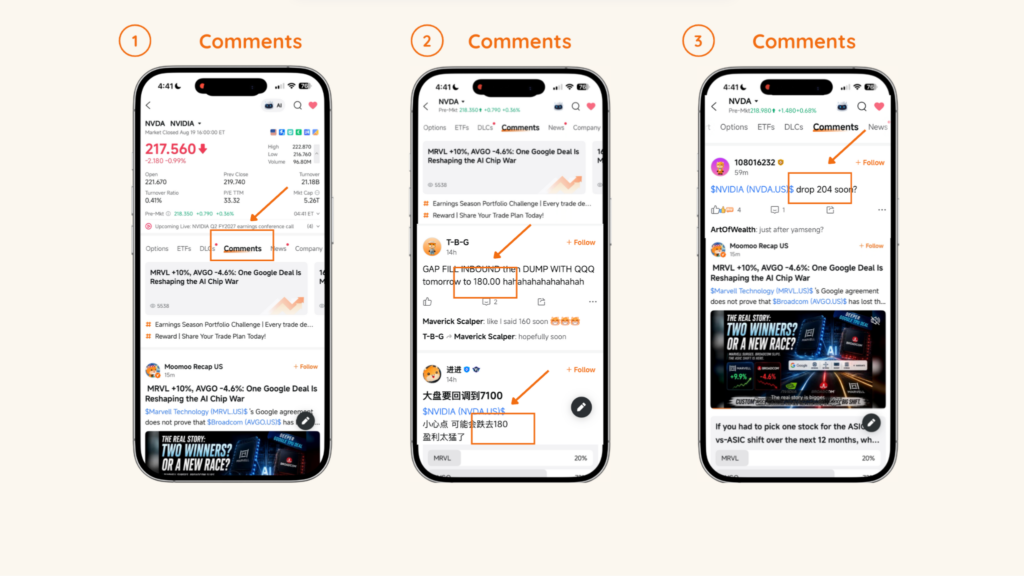
Then the retail crowd. Scrolling the comments: somebody says 180. Somebody says 204. Somebody says 288. Three different numbers, and none of them explains why.
But two posts were worth the scroll.
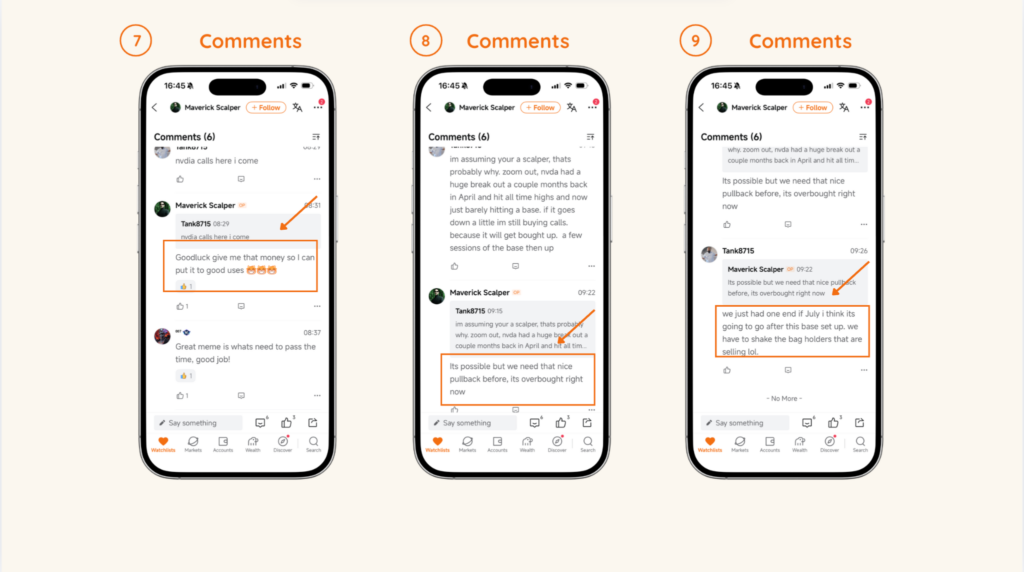
The first flagged that Michael Burry had reportedly added to a short position while Cathie Wood had been buying. Two of the most-watched investors alive, taking opposite sides of the same stock. If they can’t agree, nobody in the comments section is going to hand me the answer.
The second was an argument between two users. Read properly, one is saying zoom out, it broke out in April, it’s building a base, he’s buying dips. The other says it’s overbought and he wants a pullback first.
They aren’t actually disagreeing about Nvidia. One is holding for months; the other is trading it today. Most arguments you’ll see online are exactly this: two people on different timeframes talking past each other.
Step to Use Moomoo’s Comments:
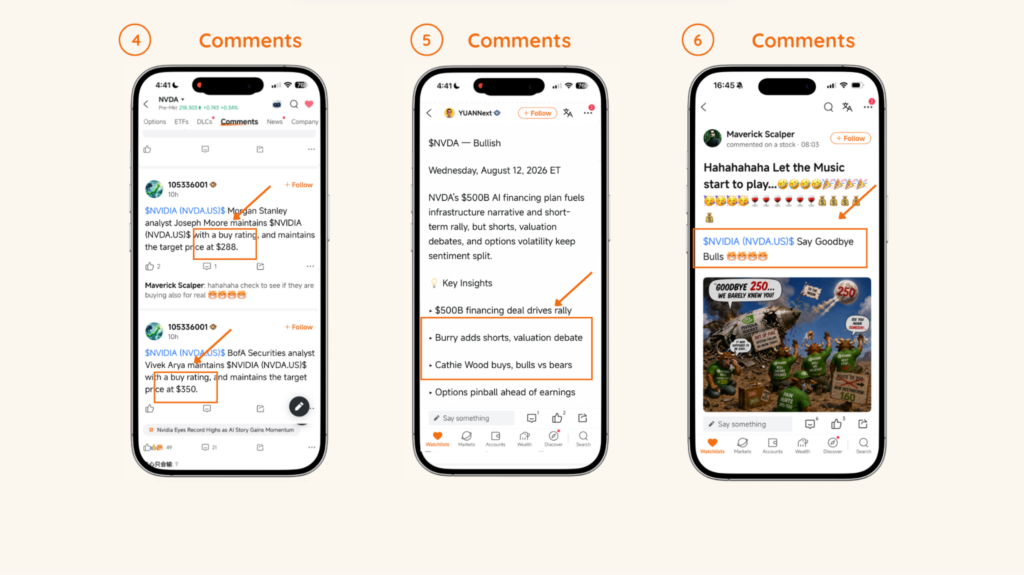
That’s what I use this section for. Not to be told what to think, but to find where the disagreement actually sits, and to catch the one argument I hadn’t considered.
Level 4: green tick. Professional and retail views in the same app, and I never opened Reddit once. Just know what you’re reading, most of it is noise, and the useful part is the disagreement.
Level 5: Stock Comparison
This is the level most people skip, which is exactly why they get it wrong. A number on its own means nothing.
74% gross margin sounds amazing. A PE of 33 sounds pricey. Compared to who?
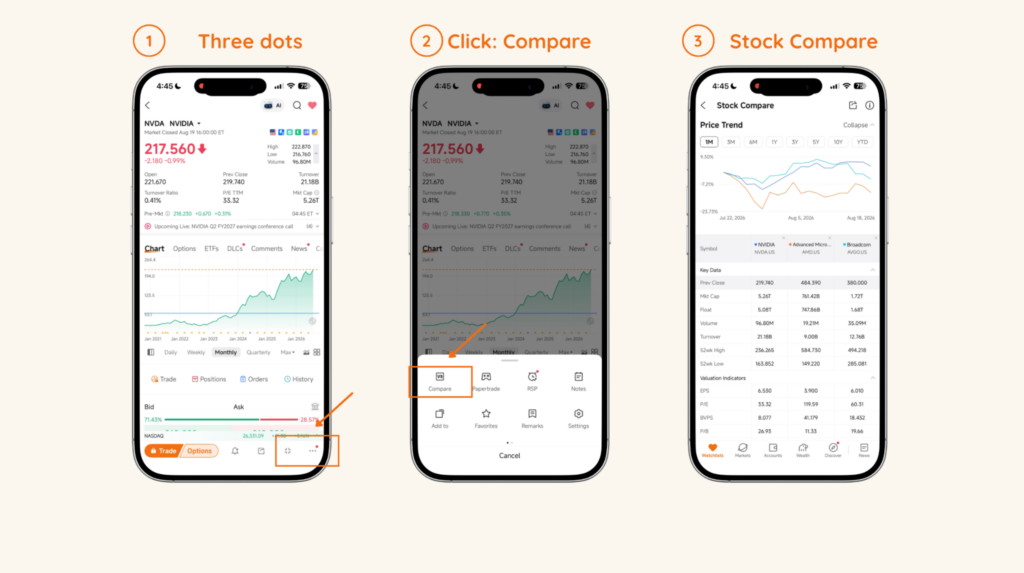
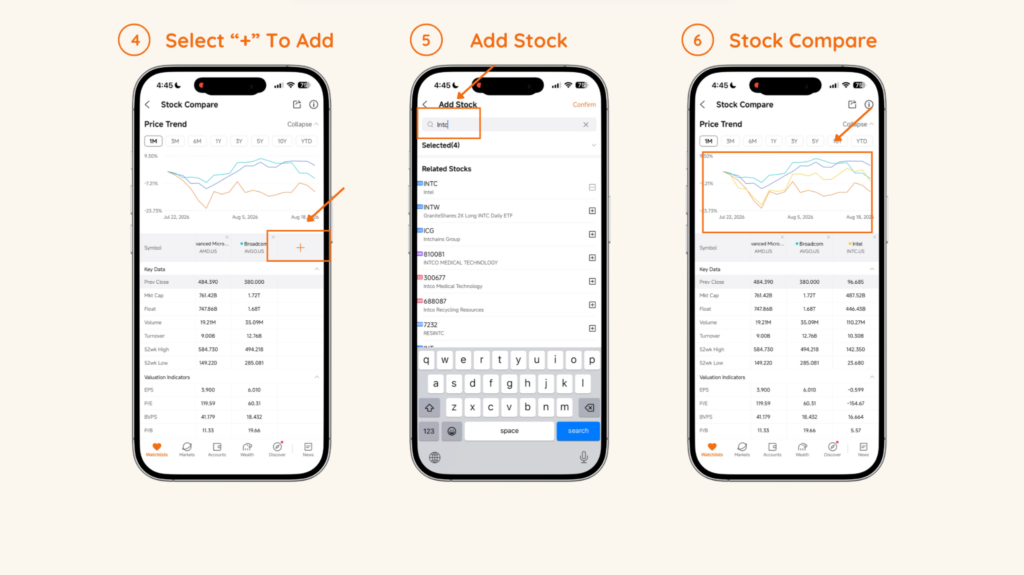
So put it next to its competitors. On the Nvidia stock page, tap Compare, then add AMD, Intel, and Broadcom.
Step to Use Moomoo’s Comparison Tool:
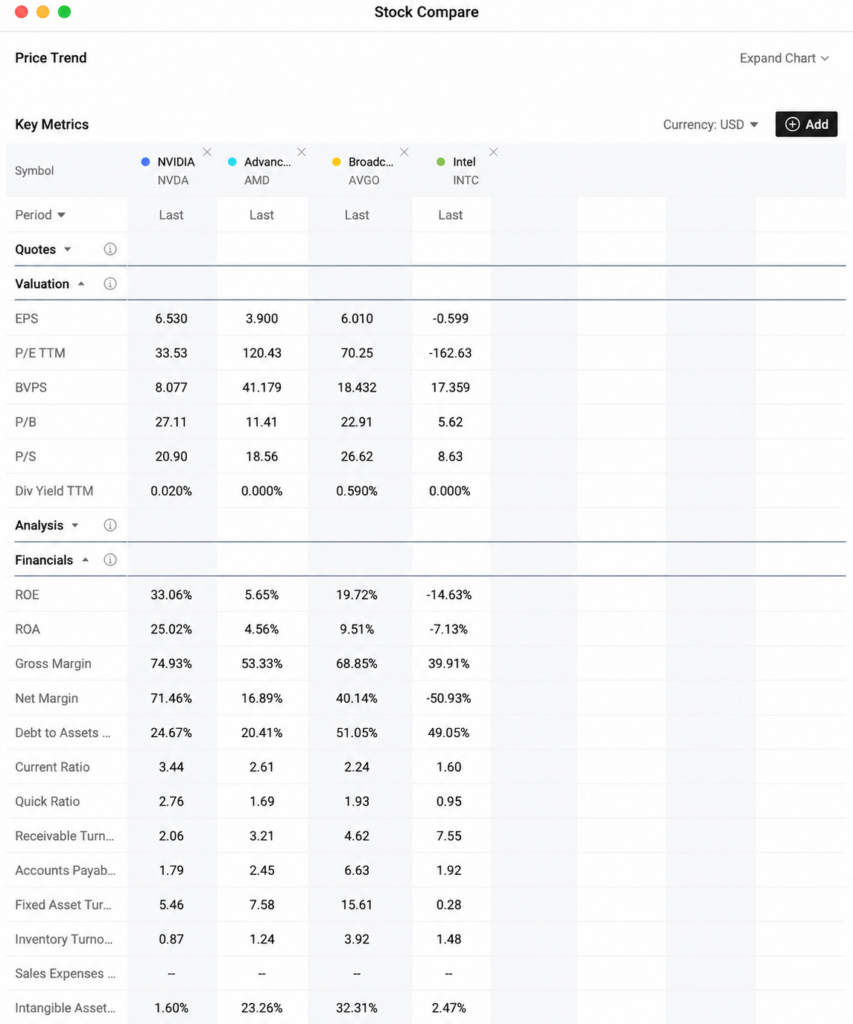
Start with the PE. Nvidia: 33. AMD: 120. Broadcom: 70. Intel: −162.
Stop there for a second, because −162 is not the cheapest thing on that screen. It means Intel is making a loss. Earnings per share: −60 cents. Once a company loses money, its PE stops meaning anything at all. Never read a negative PE as cheap.
Which leaves three companies actually making money, and Nvidia is the cheapest of them on earnings. The stock most people call the most overhyped in the world is not where most people would guess.
So why is it cheaper? Look at what each one actually earns.
Gross margin, ranked: Nvidia, then AMD, then Broadcom, then Intel. Net margin, what’s left in the company, same order. Return on equity, which shows how much profit is generated for every dollar shareholders put in: same again, with Intel negative because it’s losing money.
For every dollar shareholders put in, Nvidia earns close to six times what AMD does, and you pay less than a third of AMD’s multiple to own it.
Now the tricky part. Change one row and the story flips.
PE measures price against profit. PB, price to book, measures price against what the company actually owns: buildings, cash, equipment. On PE, Nvidia is the cheapest name on the screen. On PB, it’s the most expensive. Opposite answers, same company.
That’s the real point of this level. No single number tells you whether something is cheap. You only find out by comparing.
Level 5: green tick. Three competitors on one screen in about three minutes,the step most people never take.
Level 6: How To Execute A Trade
Screeners, financials, and news feeds are excellent for making an informed decision. But a trading platform is ultimately judged on trade power: can it actually execute your strategy?
This is where the app impressed me most. You’re not limited to buying stocks, there’s a full range, from global equities and ETFs to options, futures, and IPOs, all inside one app.
Having the choices and using them properly is different.
Most people, once they’ve decided, just hit Buy at whatever price the screen shows that second. Two things I do instead.
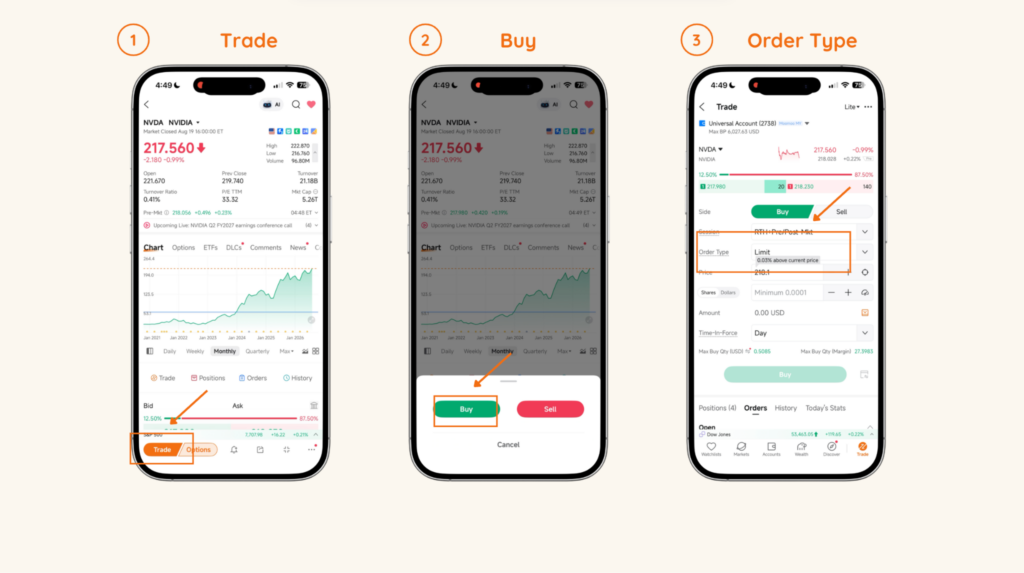
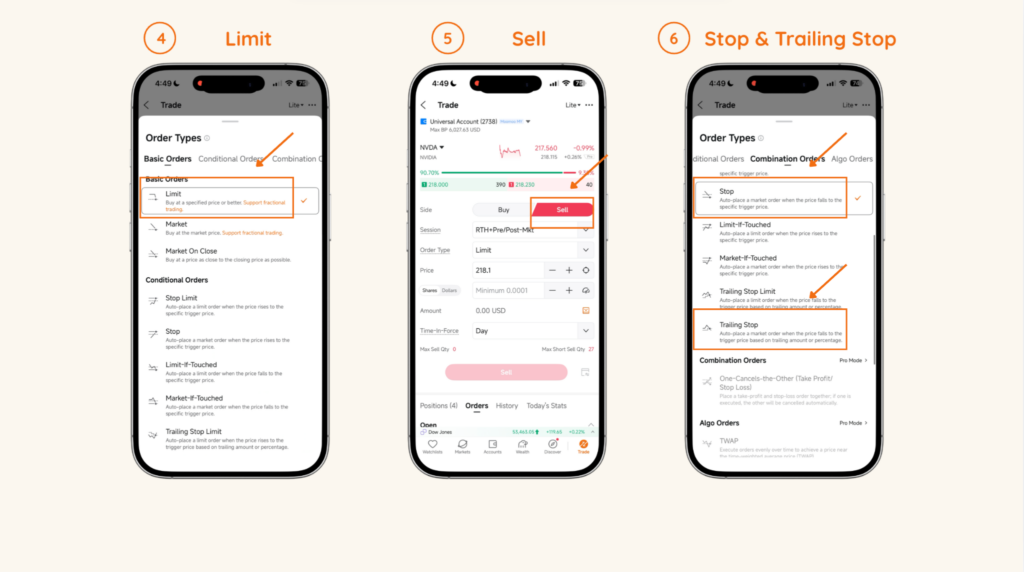
Set a limit order. Rather than accepting whatever the market offers, I decide my price. If the stock comes down to my number, the order fills automatically. If it doesn’t, I won’t buy it. That single habit stops you chasing and overpaying.
Set a stop loss. The question nobody asks before buying: what do I do after I buy the stocks and it drops? A stop loss answers it in advance. You set a level, and if the price reaches it, the app sends a sell order.
Be precise about what that means, because this trips people up. A stop loss is not a promise that you’ll lose exactly 15%. It triggers an order once your level is hit, and in a sudden decline your fill can be worse than the level you set. What it really does is make the decision for you while you’re still calm.
And the smarter version, the trailing stop. Instead of a fixed floor, it follows the price upward. As the stock rises, your stop rises with it. If the stock turns, the sell order triggers. It lets a winner run while protecting the gains you already have.
Step to Trade and Select Order Type on Moomoo:
Same app, same session: full investigation, then explicit rules for getting in and getting out.
Level 6: green tick, and this is the one it passed most comfortably.
Final Thoughts
Six levels. Six green ticks. Not one other tab opened.
An entire end-to-end stock workflow, start to finish, inside a single app.
But the point is that the process above is one you’ll actually finish. Thirty tabs is how research dies halfway through, you get overwhelmed, you give up, and you end up buying on vibes anyway. Cutting it to one app saves the time and money you’d have lost to a decision you never really made.
Besides, traditional brokers often charge a high minimum brokerage every time you buy or sell, which quietly punishes anyone investing smaller amounts. Moomoo gives new users zero commission on both US and Malaysian stocks for the first 180 days, and a small flat platform fee after that. You shouldn’t have to overpay simply to execute your own strategy.
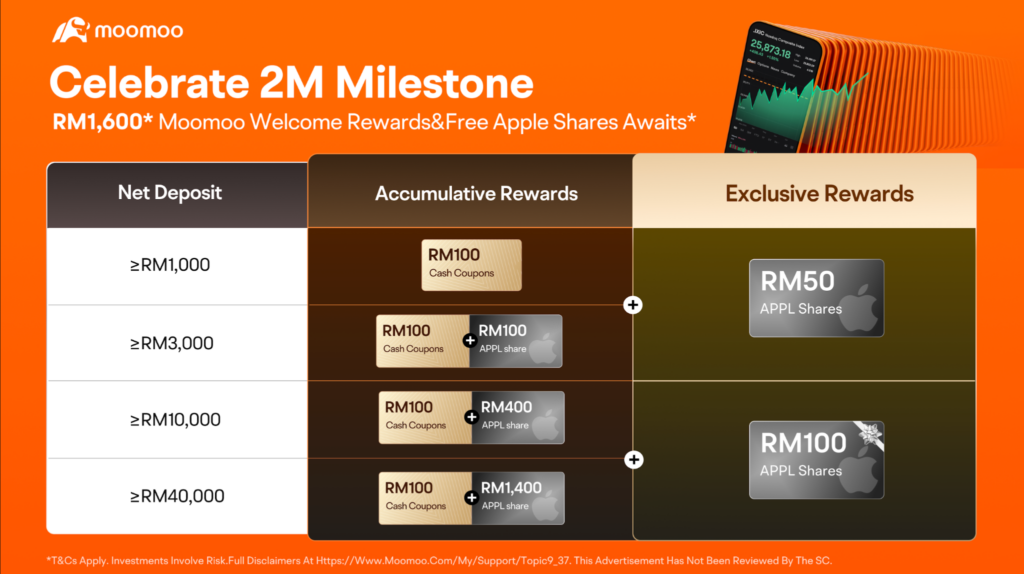
If you want to try the same tools, you can sign up for a Moomoo account. They’re currently giving away up to RM1,600 worth of Apple stock plus RM100 cash for new users. Remember to use my special deposit code “ZIET11” to unlock an extra RM 50 worth of Apple stock by depositing a minimum RM1,000 into the account.
Anyways, if you prefer a video version of this article, I have made a video covering the exact same thing – do check it out here! Thanks for reading!
*T&Cs apply. All views expressed in this blog are the independent opinions of Ziet, which are not shared by Moomoo Securities Malaysia Sdn. Bhd. (“Moomoo MY”). No content shall be considered financial advice or recommendation. Moomoo MY links are included in this post, through which referrals are made and I may receive certain commissions. Please contact Moomoo MY for more information.
Share the Wealth
Found this information useful? Share this post with your friends and family to help them stay informed about what’s happening around them. And if you’re not already subscribed, join our community to receive more insightful content directly to your hands.


